 |
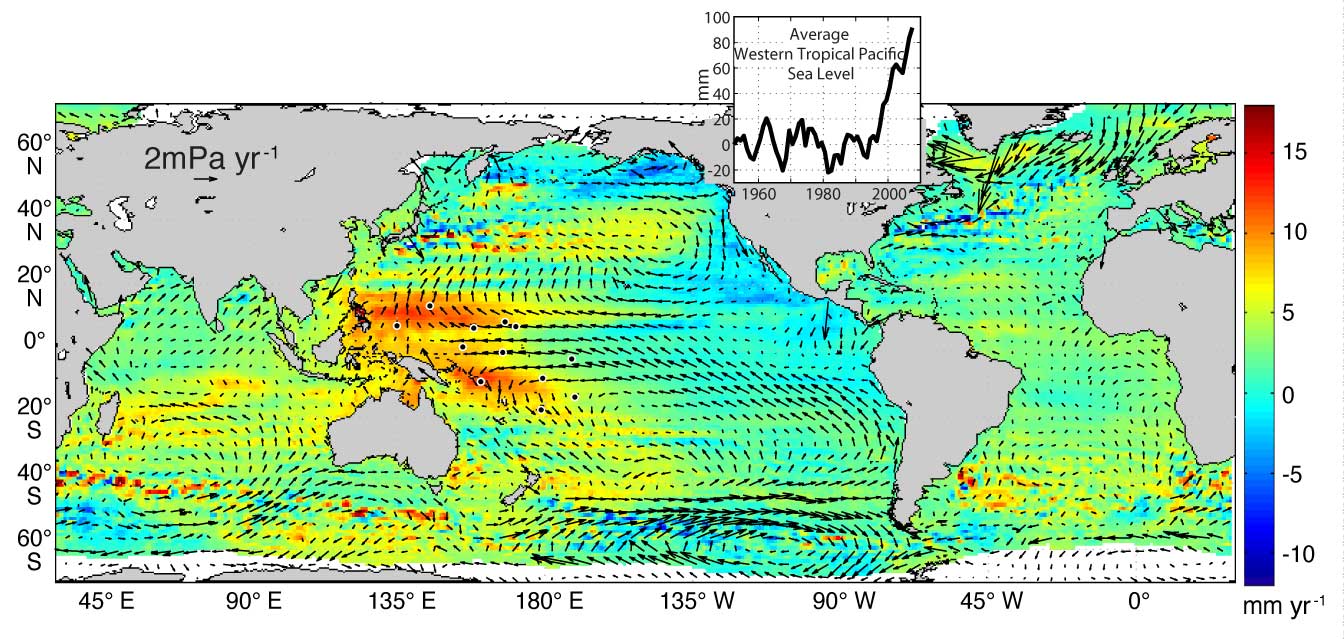
| Linear trend (1993-2010) of satellite altimeter sea surface height showing he region of high rates in the western Tropical Pacific (Source) |
 |
| Source (much larger image): NOAA |
Here's a simulated (and rather satisfying) satellite image of the main group; Kaua'i is the larger island on the left, O'ahu to the right of it, left of centre, Maui of similar size right of centre, and Hawa'ii (Big Island) very prominent on the right. I understand there's an undersea volcano some 20km to the SE of Big Island, it may have broken the surface in 20,000 years or so, and if mankind survives CAGW and catastrophic sea-level rise, might be seen by future generations. Could it be the white blob in the bottom RH corner? Book your holidays now.
 |
| Source: NOAA |
Midway demonstrates the late 20th., early 21st. century shift upwards quite well (note that the data extends to end 2011 in all cases).

Midway shows an interesting trend; dropping until the late 1970s, climbing to a relatively stable period from the late 1980s to 1997, when there's a sharp dip (not reflected in the 5-year (61 month) moving average) due to the 1997/8 El Niño. There's then a sharp rise to 1999 and a significantly higher level (clearly shown by the moving average). Don't pay any attention to the overall trend; with such fluctuating levels, it's clearly meaningless. Moving down to the westernmost island in the main group. Kaua'i Island, where the overall trend is steadier and more meaningful:

No sign of late 20th. century acceleration evident there. Next O'ahu, where the capital Honolulu is situated:

Honolulu shows more peaky 5-year profile, but still a relatively steady trend, reflected in a plot of annual averages:

The long-term rate evolution below, produced by plotting the linear trend from 1905 to the year shown on the x-axis reveals that the long-term trend is still reducing; if there'd been a significant shift upwards in annual rate in recent decades, the plot would show first a flattening, then an upward trend, in this plot.

Mokuoloe Island (Coconut Island) in Kaneohe Bay on the NE coast of O'ahu.

Is the reason Honolulu and these other islands show a rate lower than what we're told the global rate was over the 20th.century due to the land rising? The GPS plot for Honolulu seems to show otherwise, at least for the recent past. There's little vertical movement; the trend is -0.3 mm/year since 1998.
 |
| Source: SONEL |
Kahalui Harbor, Maui Island.
The rate's a little higher, but the overall profile is similar to Kaua'i Island.
Kawaihae, on the NW coast of Hawai'i Island (also known as Big Island, for obvious reasons)

This is the island with the BIG volcanoes, and the if change in actual sea level ( as opposed to the rate relative to the land, as shown by the tide gauge) is the same or nearly so as that at the islands covered so far, then it (or at least the gauge) must be sinking at a significant rate.
Hilo,on the NE of Hawai'i Island shows rather less of a rate. Perhaps the island is tilting somewhat?

I'd say that my hypothesis has some evidence to support it. If so, does it mean that some estimates of past and current sea-level rise are in error? There may be other gauges situated in "neutral zones" relatively unaffected by climatic cycles which give a better, or at least less distorted picture of sea-level rise than we're being presented with.
UPDATE: 14th. July 2012
I came across this picture of Hawai‘i Island, with the location of my "undersea volcano" actually known as Lōʻihi Seamount. It's not the "white blob in the bottom RH corner" of the illustration of the main island group above, but the lesser blob just above it, and it's 20 miles off the coast, not my "20 km".
 |
| Lōʻihi Seamount, Hawai'i Island, Hawai'i Source: University of California, Santa Barbara |
Reference: Regional sea-level trends due to a Pacific trade wind intensification
Merrifield, M. A., and M. E. Maltrud, Geophys. Res. Lett., in press, 2011.
Data Sources: (in order of presentation):
Midway Island
Nawiliwili Bay, Kaua'i Island
Honolulu, O'ahu
Mokuoloe Island
Kahalui Harbor, Maui Island
Kawaihae, Hawai'i Island
Hilo, Hawai'i Island
No comments:
Post a Comment