 |
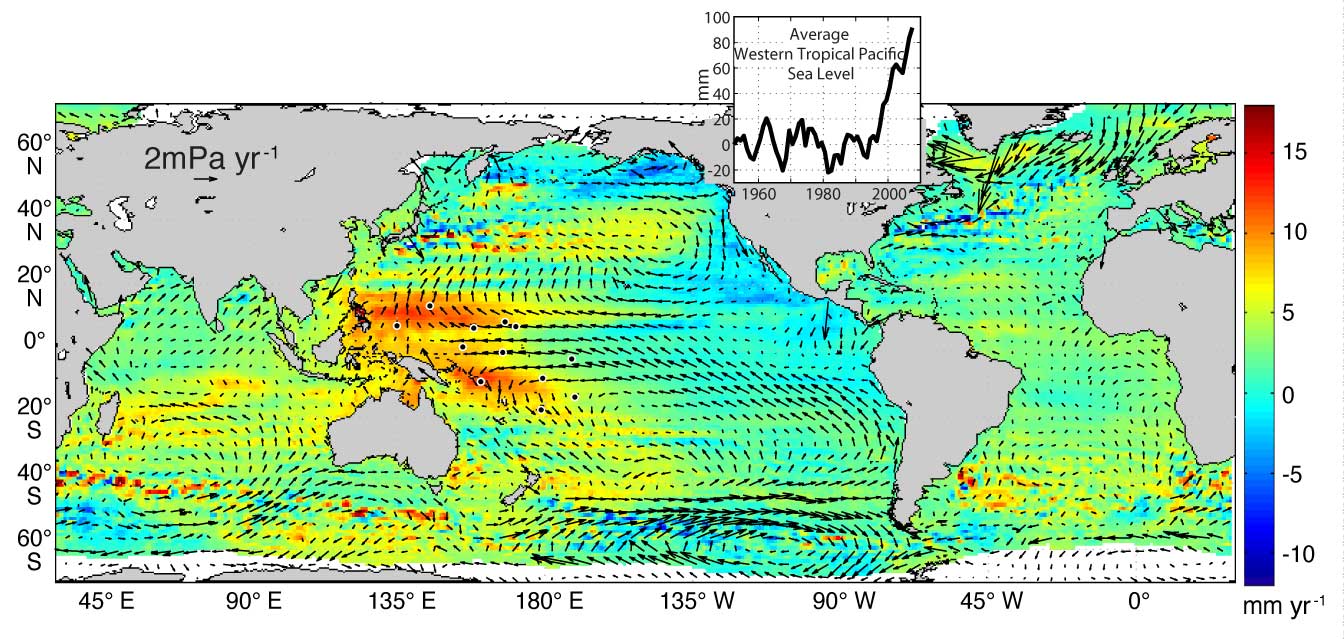
| Map 1 - Linear trend (1993-2010) of satellite altimeter sea surface height showing he region of high rates in the western Tropical Pacific (Source) |
 |
| Map 2 Source: Why sea level rise isn’t level at all (NASA blog) |
What stands out is the swathe of green (negative change) from Alaska down along the US west coast to Mexico and beyond. Incidentally, some sceptics (who should know better) have scoffed at graphics such as these, claiming that the very high rates of increase shown in the western Pacific are "fiction", and therefore the entire maps aren't to be trusted. I tended to agree (mea culpa) , until I began actually checking the depicted rates against tide gauge data over the time period(s) of the map(s). To date I've not found any but minor discrepancies, and where it's possible to take account of changes in land (and therefore gauge) height any such differences are mostly of the order of a few tenths of a mm/year at the very most.
However, looking at some of the actual plots will illustrate the situation and confirm the veracity of the satellite data. I initially planned to start in the south and work northwards, but decided to show what I think is the most interesting plot, for Port San Luis, N of Santa Barbara.

 |
| Port San Luis, CA source: PSMSL |
I'm not stating that sea level will continue to fall at Port San Luis. I'm not even suggesting it. I'm merely pointing out what is happening now (to the end of the last complete year of published data), and what has happened in recent decades.
My question at this point is whether city and state planners, local businesses and citizens actually know that sea level along the Californian coast has been stable for decades, and has been falling at almost all gauge sites for the last decade or two? If not, why not? Authorities around San Francisco Bay are wetting themselves about possible huge future sea level rise "predictions", and many appear to have convinced themselves that effects such as beach erosion are due to recent sea level rise, when the records show nothing of the sort. For example, there's been a gauge at Alameda Naval Air Station (East across the Bay from San Francisco) since 1939.

 |
| Alameda (Naval Air Station), CA source: PSMSL |
... where the current 5-year average is lower than it was in the late 1960s, and the current rate is clearly negative. Most assessment reports I've seen brush the inconvenient facts "under the carpet" and only mention global data and the scary predictions. Some (see Missing the Point in California) are so mesmerised by this misinformation they can't see what's under their noses. There's no doubt that sea levels are rising globally. There's no doubt that effects such as ENSO raise and lower sea levels across the Pacific. The peaks from the strong 1982-3 and 1997-8 El Niños stand out for the two previous examples, and for all west-coast sites from southern California to Alaska. The Pacific Decadal Oscillation has an impact - it was strongly positive from the late 1970s to around 2008, and in that phase tends to raise sea levels in the west, and lower them in the east, our area of study.
Is the story the same at all stations in California? Not quite - Humboldt Bay (about 120 km S of the Oregon state line) is an outlier, and shows up on map 2 above (click to get the original) as a pale orange blob at the apex of the "bulge" of the Californian coast.
 |
| Source: PSMSL |
Note however, that while the calculated trend is 4.7 mm/year overall, the rolling profile of the 3-year moving average is similar to the previous examples, and this indicates that North Spit must be sinking at a greater rate than other sites to the south, and a greater rate than the sea level is falling, resulting in a small positive rate since the early 1990s.
Plots for San Francisco and Point Reyes can be seen here, and data for all the west coast stations are linked on the Permanent Service for Mean Sea Level (PSMSL) page here - scroll down three-quarters of the page on the scroll bar.
Things will change, there's no doubt, but precisely which way, and to what extent, no one knows. Now that's a fact. Don't believe what you read, not even what you read here. I do my best to be truthful and unbiased, but I still have an overall point of view, and it may colour my presentation of what I see as facts. Check my references, check other blogger and web author's references, and remember - the truth may only be a click away (or two clicks if you have Windows Vista).
No comments:
Post a Comment