An idyllic scene - a view over Newlyn harbour, Cornwall UK. In the background to the east rises historic St. Michael's Mount. Note the red-and-white painted lighthouse and adjacent hut. The unassuming hut has the grand-sounding title of the Newlyn Tidal Observatory. The hut houses several things, but the most important is a simple domed brass bolt set in a recess in the granite below the floor. The top of the domed head is the benchmark for all height measurements in the UK.
 |
| Ordnance Survey benchmark, Newlyn |
Newlyn was chosen because of the stability of the site - a solid Cornish granite pier set on solid Cornish granite bedrock. However solid the foundations though, even this site might be subject to horizontal and/or vertical movement of the Earth's crust below. Careful levelling over the decades since the tidal gauge was set up in 1915, confirmed by CGPS measurements in recent years show that isn't the case.
 |
| CGPS plot for Newlyn Observatory 1999-2010 Source:Sonel |
The CGPS (Continuous GPS) plot shows -0.03 mm/year between 1999 and 2010 (in red, to the left of the plot); it's sinking at a rate of just 3 mm per century. That's stable by any standards. Why am I telling you all this? Because of the stability of the site; the tide gauge is set in a vertical shaft in the pier with a horizontal channel to admit sea water. The record runs from 1915 and so covers most of the 20th century. Because of the stability of the gauge the tidal data can be relied on for accuracy without any adjustment for vertical movement.
Coincidentally, but also interesting, is that the overall rate is 1.78 mm/year almost identical to the generally accepted global rate for the 20th century of 1.8 mm/year.
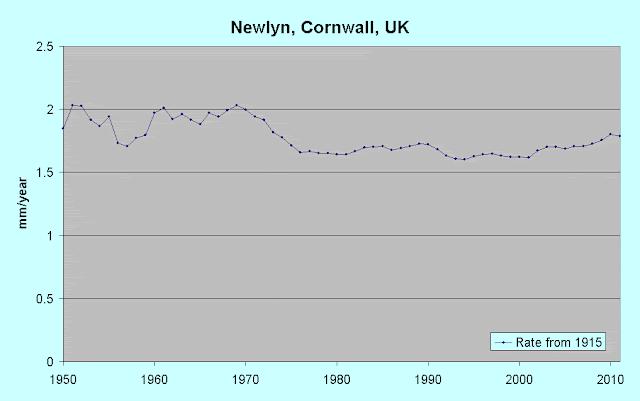 |
| Annual rate from 1915 to year on lower axis. |
By calculating and plotting the annual rates from the first year of data we can see how they've changed over time. This analysis can also reveal any acceleration in the annual rate. The above plot shows that the annual rate (from 1915) was around 2 mm/year or just below from 1950 to 1970, began to drop until 1976 (1.65 mm/year), levelled off, and rose slightly after 2001, from 1.61 to the current overall 1.76 mm/year. note that there was no significant change in rate in the last quarter of the 20th century, and just a small increase since then.
I'll be creating a sea-level reference page for Europe very soon; I already have several plots for the UK, and half-a-dozen for northern Europe.


No comments:
Post a Comment